

Appraisal almost always stops at what an investment costs and overlooks the value it creates for the economy that hosts it: wealth for households and businesses, jobs, tax revenue. That value can be measured, and measuring it changes the quality of the decision.
The question that comes from every table
The question always comes from the same place, even when the table changes: a board weighing a business plan, an authority reviewing a permitting dossier, a sustainability report to be compiled, local opposition to be met with data rather than promises. In every case, the point is to establish what the investment is worth not to whoever makes it, but to the economy that hosts it and to the one around it.
Socioeconomic impact analysis answers that question: it is a decision-making tool that turns spending into a measurable argument, one that can be defended before a board, an authority or a negotiating table.
What socioeconomic impact analysis measures
Socioeconomic impact analysis quantifies the effects that spending (a business plan, an infrastructure investment, a public programme, a major event, in some cases an entire organisation) has on the national or regional economy. It typically does so along five dimensions.
• Output: the total value of goods and services activated in the economic system.
• GDP: the impact on value added, net of intermediate transactions.
• Employment: the jobs created, expressed in full-time equivalents (FTE).
• Income: wages, profits and rents distributed to households and businesses.
• Tax revenue: the additional revenue for public finances.
How socioeconomic impact analysis works: the SAM model
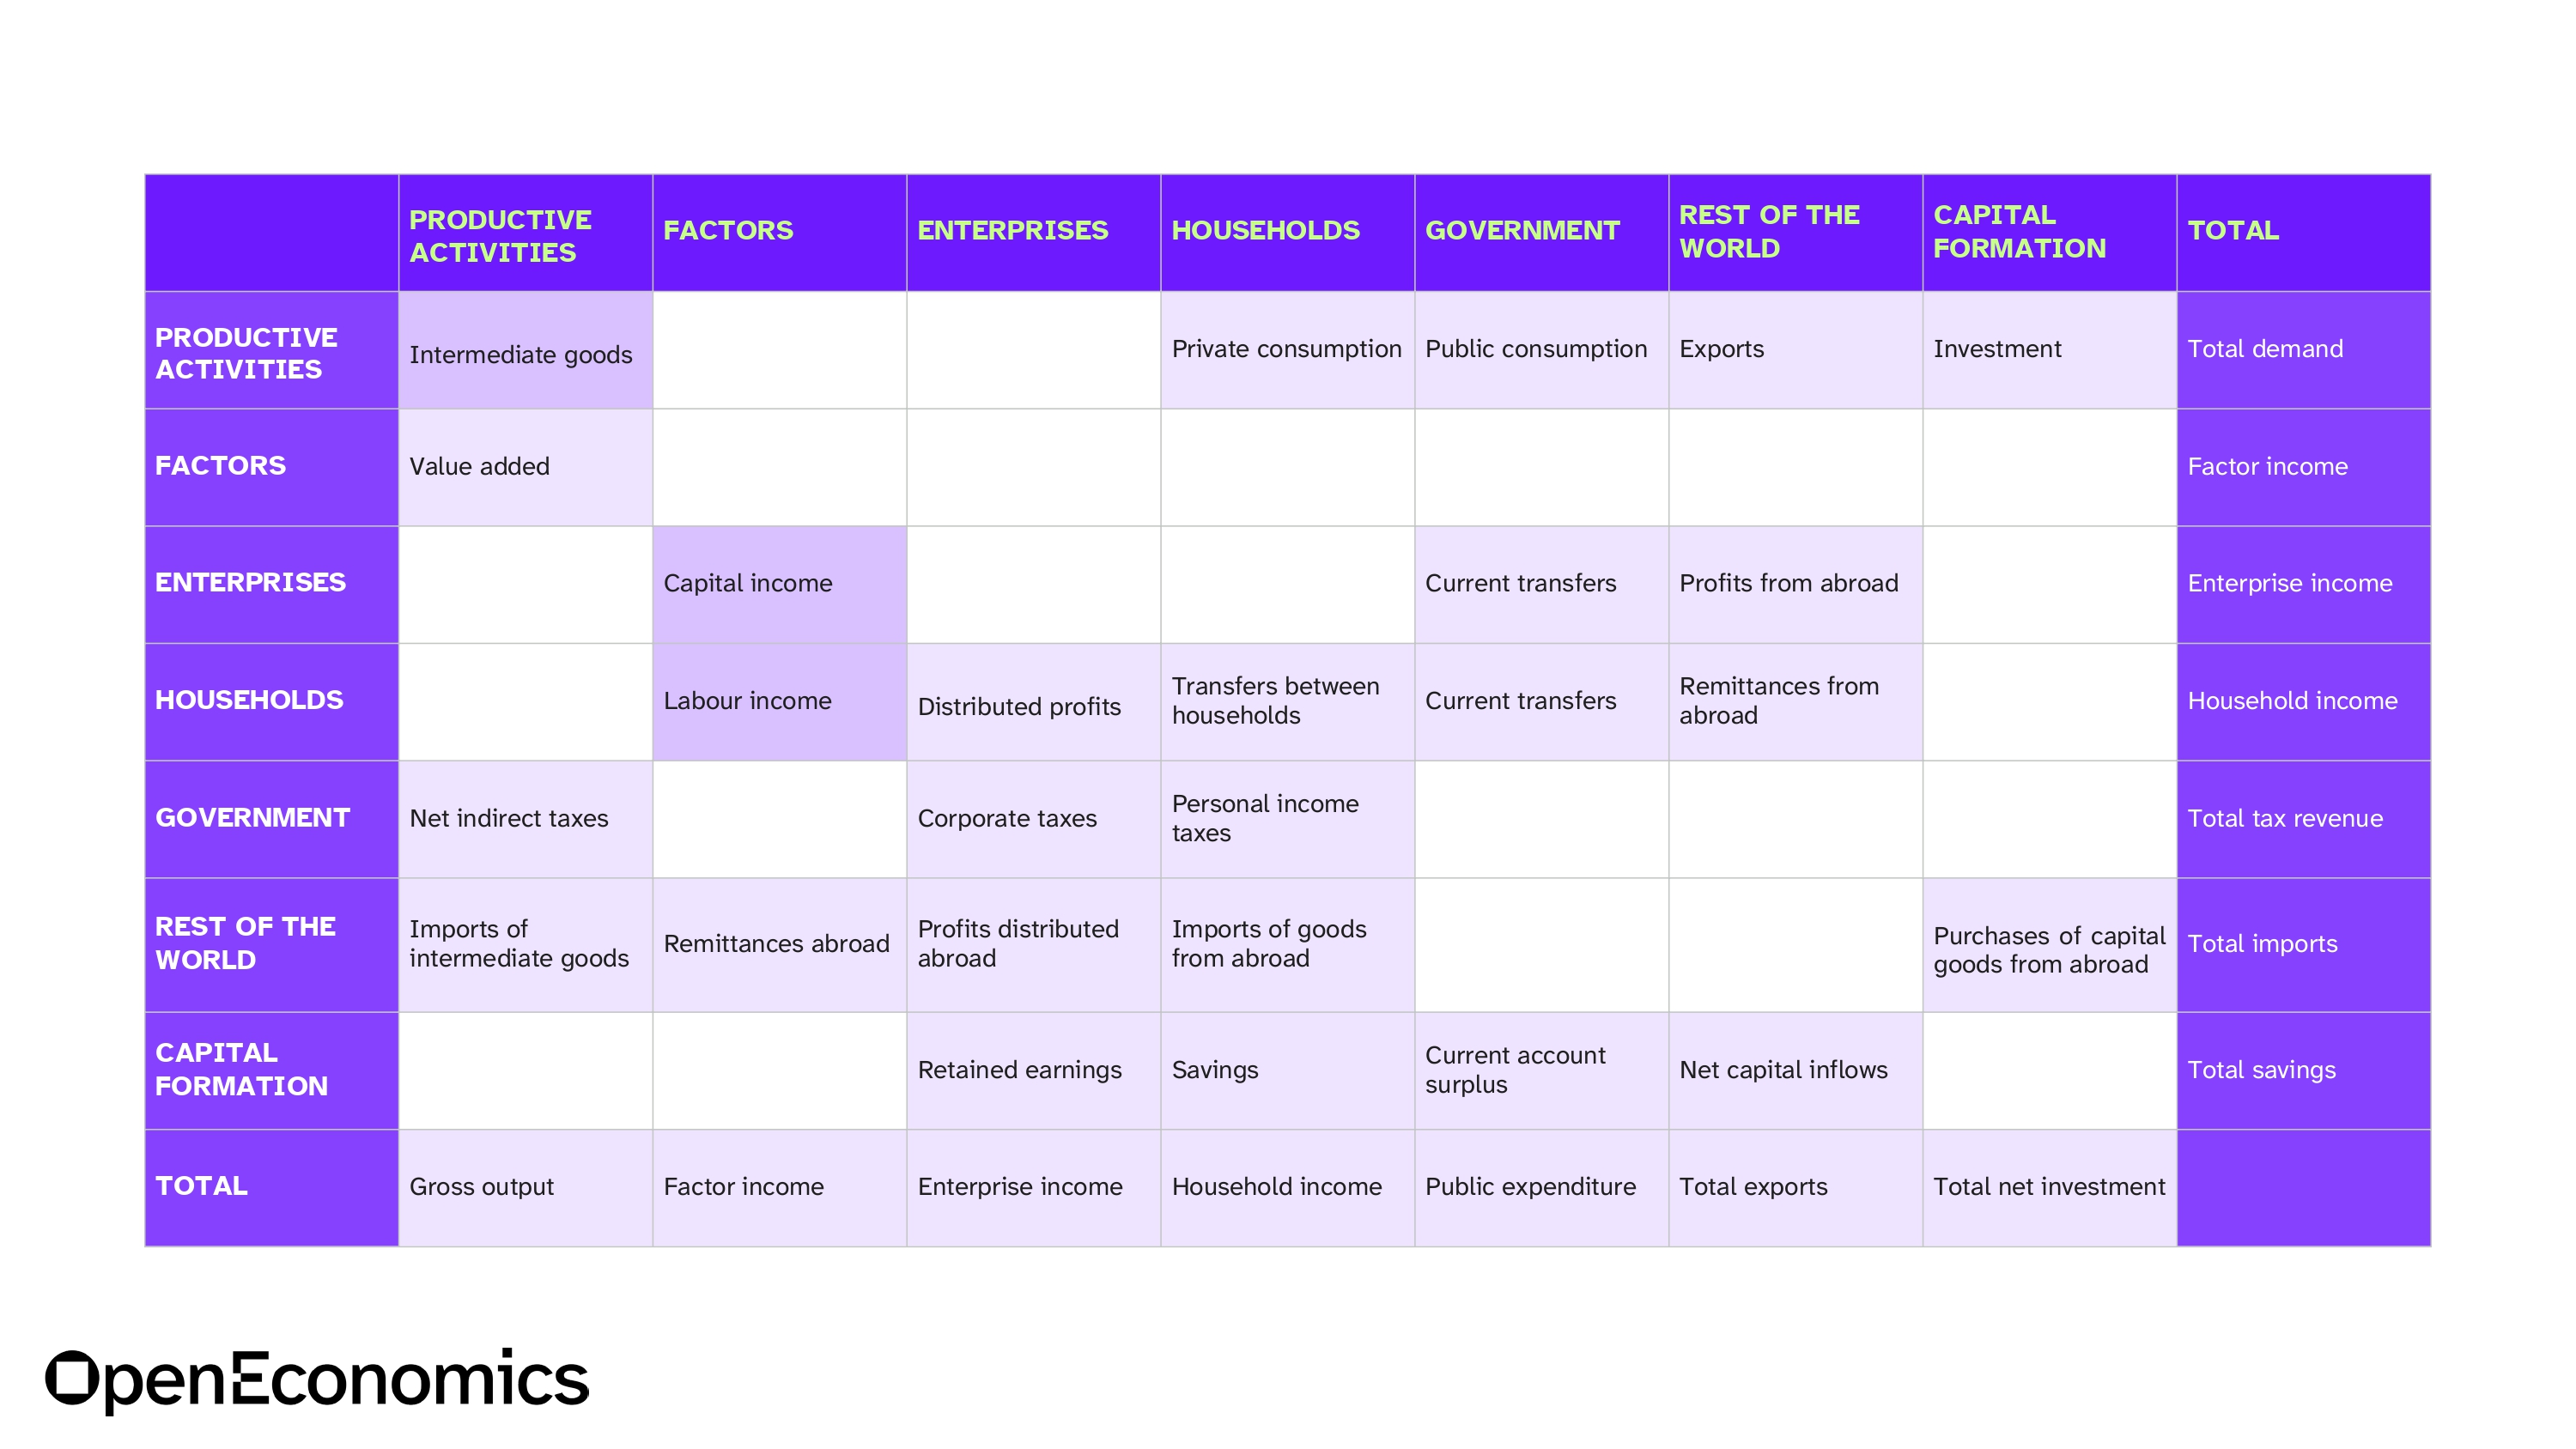
The methodological tool underlying the analysis is the SAM (Social Accounting Matrix). It describes the structure of the economy as a system of circular relationships between its agents: productive sectors, factors of production, taxes, households, businesses, government, the rest of the world and capital formation.
Reading the SAM by column means following costs: how a sector buys intermediate goods, pays workers, remunerates capital and pays taxes. Reading it by row means following income: how households receive wages, transfers and profits. It is this circularity that allows the model to trace how a shock spreads through the entire economic system, and to measure it.
The SAM used by OpenEconomics adopts ISTAT's 63-sector classification, built on the national Input-Output Tables and developed at progressively finer levels of territorial disaggregation, down to provincial detail. Disaggregation at municipal level is under development.
The three levels of propagation: direct, indirect, induced
When spending is analysed with this model, the effect does not stop at the sector that receives it directly. It spreads in three successive waves, and the real value of the investment lies in the sum of all three.
The direct impact is the value generated close at hand, through the sectors immediately involved. In the case of construction spending, it is the value added generated by the construction firms carrying out the works.
The indirect impact is the effect along supply chains. Construction firms need cement, steel, window frames, transport and technical services, and each supplier in turn activates other suppliers. The indirect impact captures the full propagation along the supply chain, including sectors that seem to have nothing to do with the construction site.
The induced impact is the subtlest and often the most significant. Workers on site and suppliers along the chain earn income and spend it on rent, food, services and leisure. That income flows back into the system and generates a further round of demand and production, well beyond the original scope of the investment.
Propagation is calculated using the Leontief multiplier matrix, obtained through successive processing of the SAM, which converts an initial demand shock into the overall impact on the economic system.
For decision-makers the consequence is concrete: construction spending does not just produce a building. It produces GDP, jobs and tax revenue along a path that can be traced back to the starting figure, and can therefore be communicated.
The GDP multiplier: a useful tool, if properly interpreted
The GDP multiplier is the most immediate indicator: it measures how many euros of GDP are generated for every euro spent. It is a concise, easy-to-grasp figure, well suited to narratives or presentations in which the concept of impact needs to be condensed.
Reading an impact analysis through multipliers alone, however, is like reading a set of accounts by looking only at the bottom line.
The multiplier says how much value is activated; it does not say in which sectors, in which areas or over how many years. Those are the three things a Managing Authority, a funding body or a counterpart at the negotiating table will ask about.
When impact analysis is applied
Socioeconomic impact analysis is used to demonstrate value. From this perspective, it lends itself to a range of applications. For example, it helps manage permitting, reputational and negotiating risk. A permitting dossier that quantifies the jobs and tax revenue generated locally can hold up in a public debate in a way that a qualitative report cannot. Measuring and communicating the impact of a major event through robust metrics carries significant communication value for its organisers and sponsors. Negotiations with public administrations and local authorities, the management of local opposition, shareholder communication and ESG reporting are other common uses.
Clearly, the tool is only as effective as its methodology. The robustness of an analysis, and how well it holds up in the contexts where it is used, depend on the quality of what lies beneath: up-to-date institutional datasets, alignment with international standards, verifiable models.




.png)








.png)