


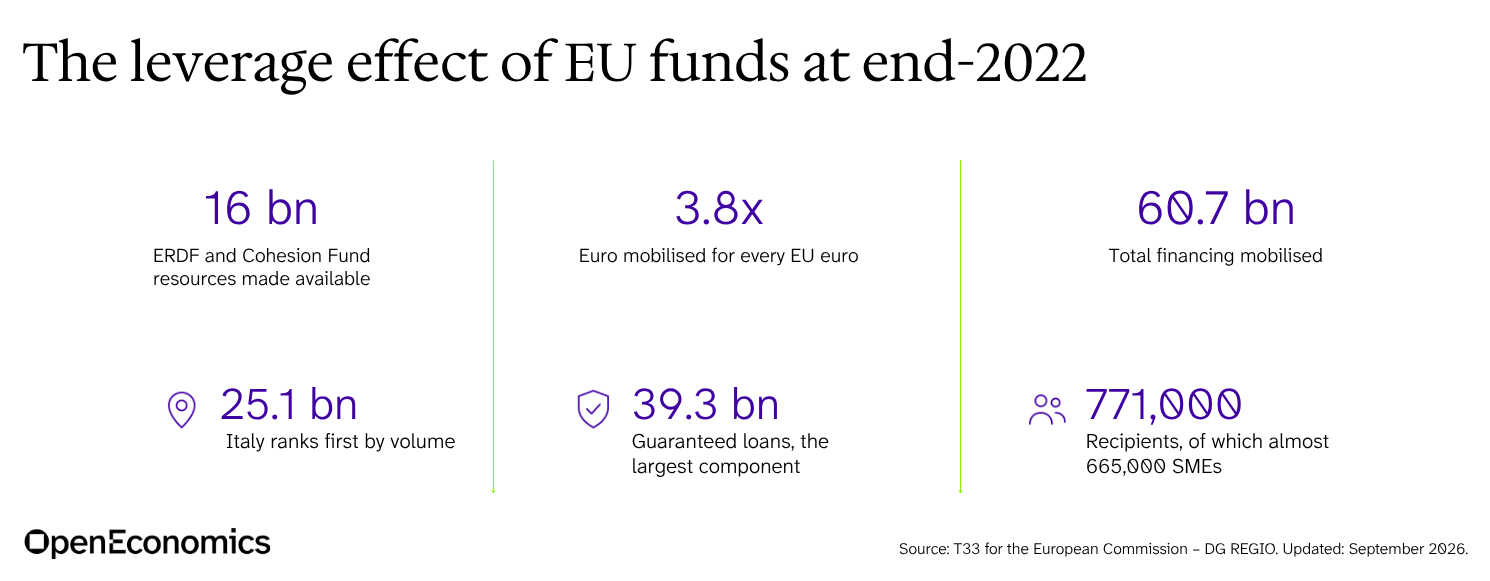
By the end of 2022, €16 billion of EU funds from the ERDF and the Cohesion Fund, made available to businesses and other final recipients, had mobilised €61 billion in financing, with a significant "leverage effect": €3.8 for every euro of EU money. Italy ranks first by volume, with €25.1 billion.
Aims of the analysis
The latest annual summary prepared by T33, an OpenEconomics group company, for the European Commission's DG REGIO describes the progress of financial instruments co-financed by EU funds in the 2014-2020 programming period and their "leverage effect", with data as at 31 December 2022. It is an institutional publication required by EU regulations and is based on the data that Managing Authorities submit every year.
Main findings
1. Every euro mobilises 3.8. By the end of 2022, financial instruments had made €16 billion from the ERDF and the Cohesion Fund available to final recipients, mainly small and medium-sized enterprises. These resources mobilised a total of €60.7 billion in financing.
2. Italy ranks first by volume. With €25 billion, it is ahead of Greece (6.5), Spain (4.3), Germany and Poland (3.5 each). In 2022 alone, guaranteed loans grew by more than €8.9 billion, of which 7.5 billion in Italy. The report attributes the differences in the leverage achieved to national co-financing, local market conditions and the type of products offered. Where co-financing is higher and banks operate on the basis of guarantees, volumes grow for the same amount of EU funding.
3. What is in the €61 billion? In addition to EU funds, the figure includes national co-financing, public or private, and resources from banks and investors. The largest item is guaranteed loans, worth €39.3 billion: credit granted by banks in return for programme resources covering part of the risk. Additional private capital at the level of final recipients amounts to €4 billion in loans and more than €4.4 billion in equity.
4. Who benefited? There are more than 771,000 final recipients, compared with around 678,000 the year before. Almost 665,000 are SMEs, of which 502,500 are micro-enterprises; 490,000 were supported with guarantees. Above all, these instruments make businesses bankable that banks alone would have found harder to support.
Key takeaways
Capital that flows back
Unlike a grant, a financial instrument returns part of the public money made available. By the end of 2022, €3.2 billion of EU funds had been returned to public authorities, compared with 1.9 billion the year before: this is money that can be used again. Being returned, however, does not mean being reinvested. Of that €3.2 billion, more than 2.4 billion (86%) had not yet been reused, and as long as it sits idle, that money makes no further contribution to public policy objectives. The regulation also allows part of the returns to be used to remunerate the private investors who invested alongside the public sector. How much money actually goes back into financing new investment therefore depends on the choices made by those managing the programmes.
Leverage depends on the instruments
Beyond the amount of public resources, it is the amount of additional private resources that determines the reach of a public intervention. And the result depends on how the instrument is designed: the type of financial product and guarantee, and the sharing of risk between the public and private sectors, calibrated to the local context and the type of recipients. These measure an instrument's financial reach, which is not the same thing as policy results.
What to watch going forward
Financial instruments remain a relatively small share of the funds committed to cohesion: around 5% in each of the last three programming periods, according to the European Court of Auditors. In 2014-2020 they amounted to €31 billion out of €405 billion. The update based on data available at the end of 2023, still in progress, will make it possible to check three things: whether the 3.8 leverage effect holds at programme closure, how much of the returns has gone back into financing businesses, and how much has been used to remunerate private investors.



.png)








.png)