


An investment is worth what it generates, not what it costs. Yet most investment decisions stop at costs and leave out of the assessment the value that investment creates for the economy: how much wealth does it generate for households and businesses? How many social benefits does it produce? That value can be measured. And by measuring it, the quality of decisions changes.
Presenting an industrial plan to a board. Supporting a permitting application before a competent authority. Quantifying an organisation’s contribution to the local economy for a sustainability report. Responding to community opposition with data, not promises.
In all these contexts, the question is always the same: how much is this investment worth—not for those making it, but for the economy that hosts it and the surrounding one?
Socioeconomic impact analysis answers this question: a decision-making tool that turns expenditure into a measurable and citable argument in the contexts that matter.
What impact analysis measures and why ROI is not enough
Socioeconomic impact analysis quantifies the effects that an expenditure—an industrial plan, an infrastructure investment, a public programme, even an entire organisation—produces on the national or local economy.
It does so simultaneously along five dimensions:
• Output: the total value of goods and services generated throughout the economic system
• GDP: the impact on value added net of intermediate transactions
• Employment: the jobs created, expressed in full-time equivalents (FTEs)
• Income: wages, profits and rents distributed to households and businesses
• Tax revenue: additional revenue for public finances
It is worth dwelling on a distinction that is often useful in reporting and communication contexts. Output tends to overestimate the wealth generated by an investment because it includes intermediate transactions along supply chains. GDP, which measures value added net of intermediate transactions, is the most appropriate measure for assessing the real impact on an economy. Choosing the right metric according to the context and the audience is already part of the analysis.
How socioeconomic impact analysis works: the SAM model
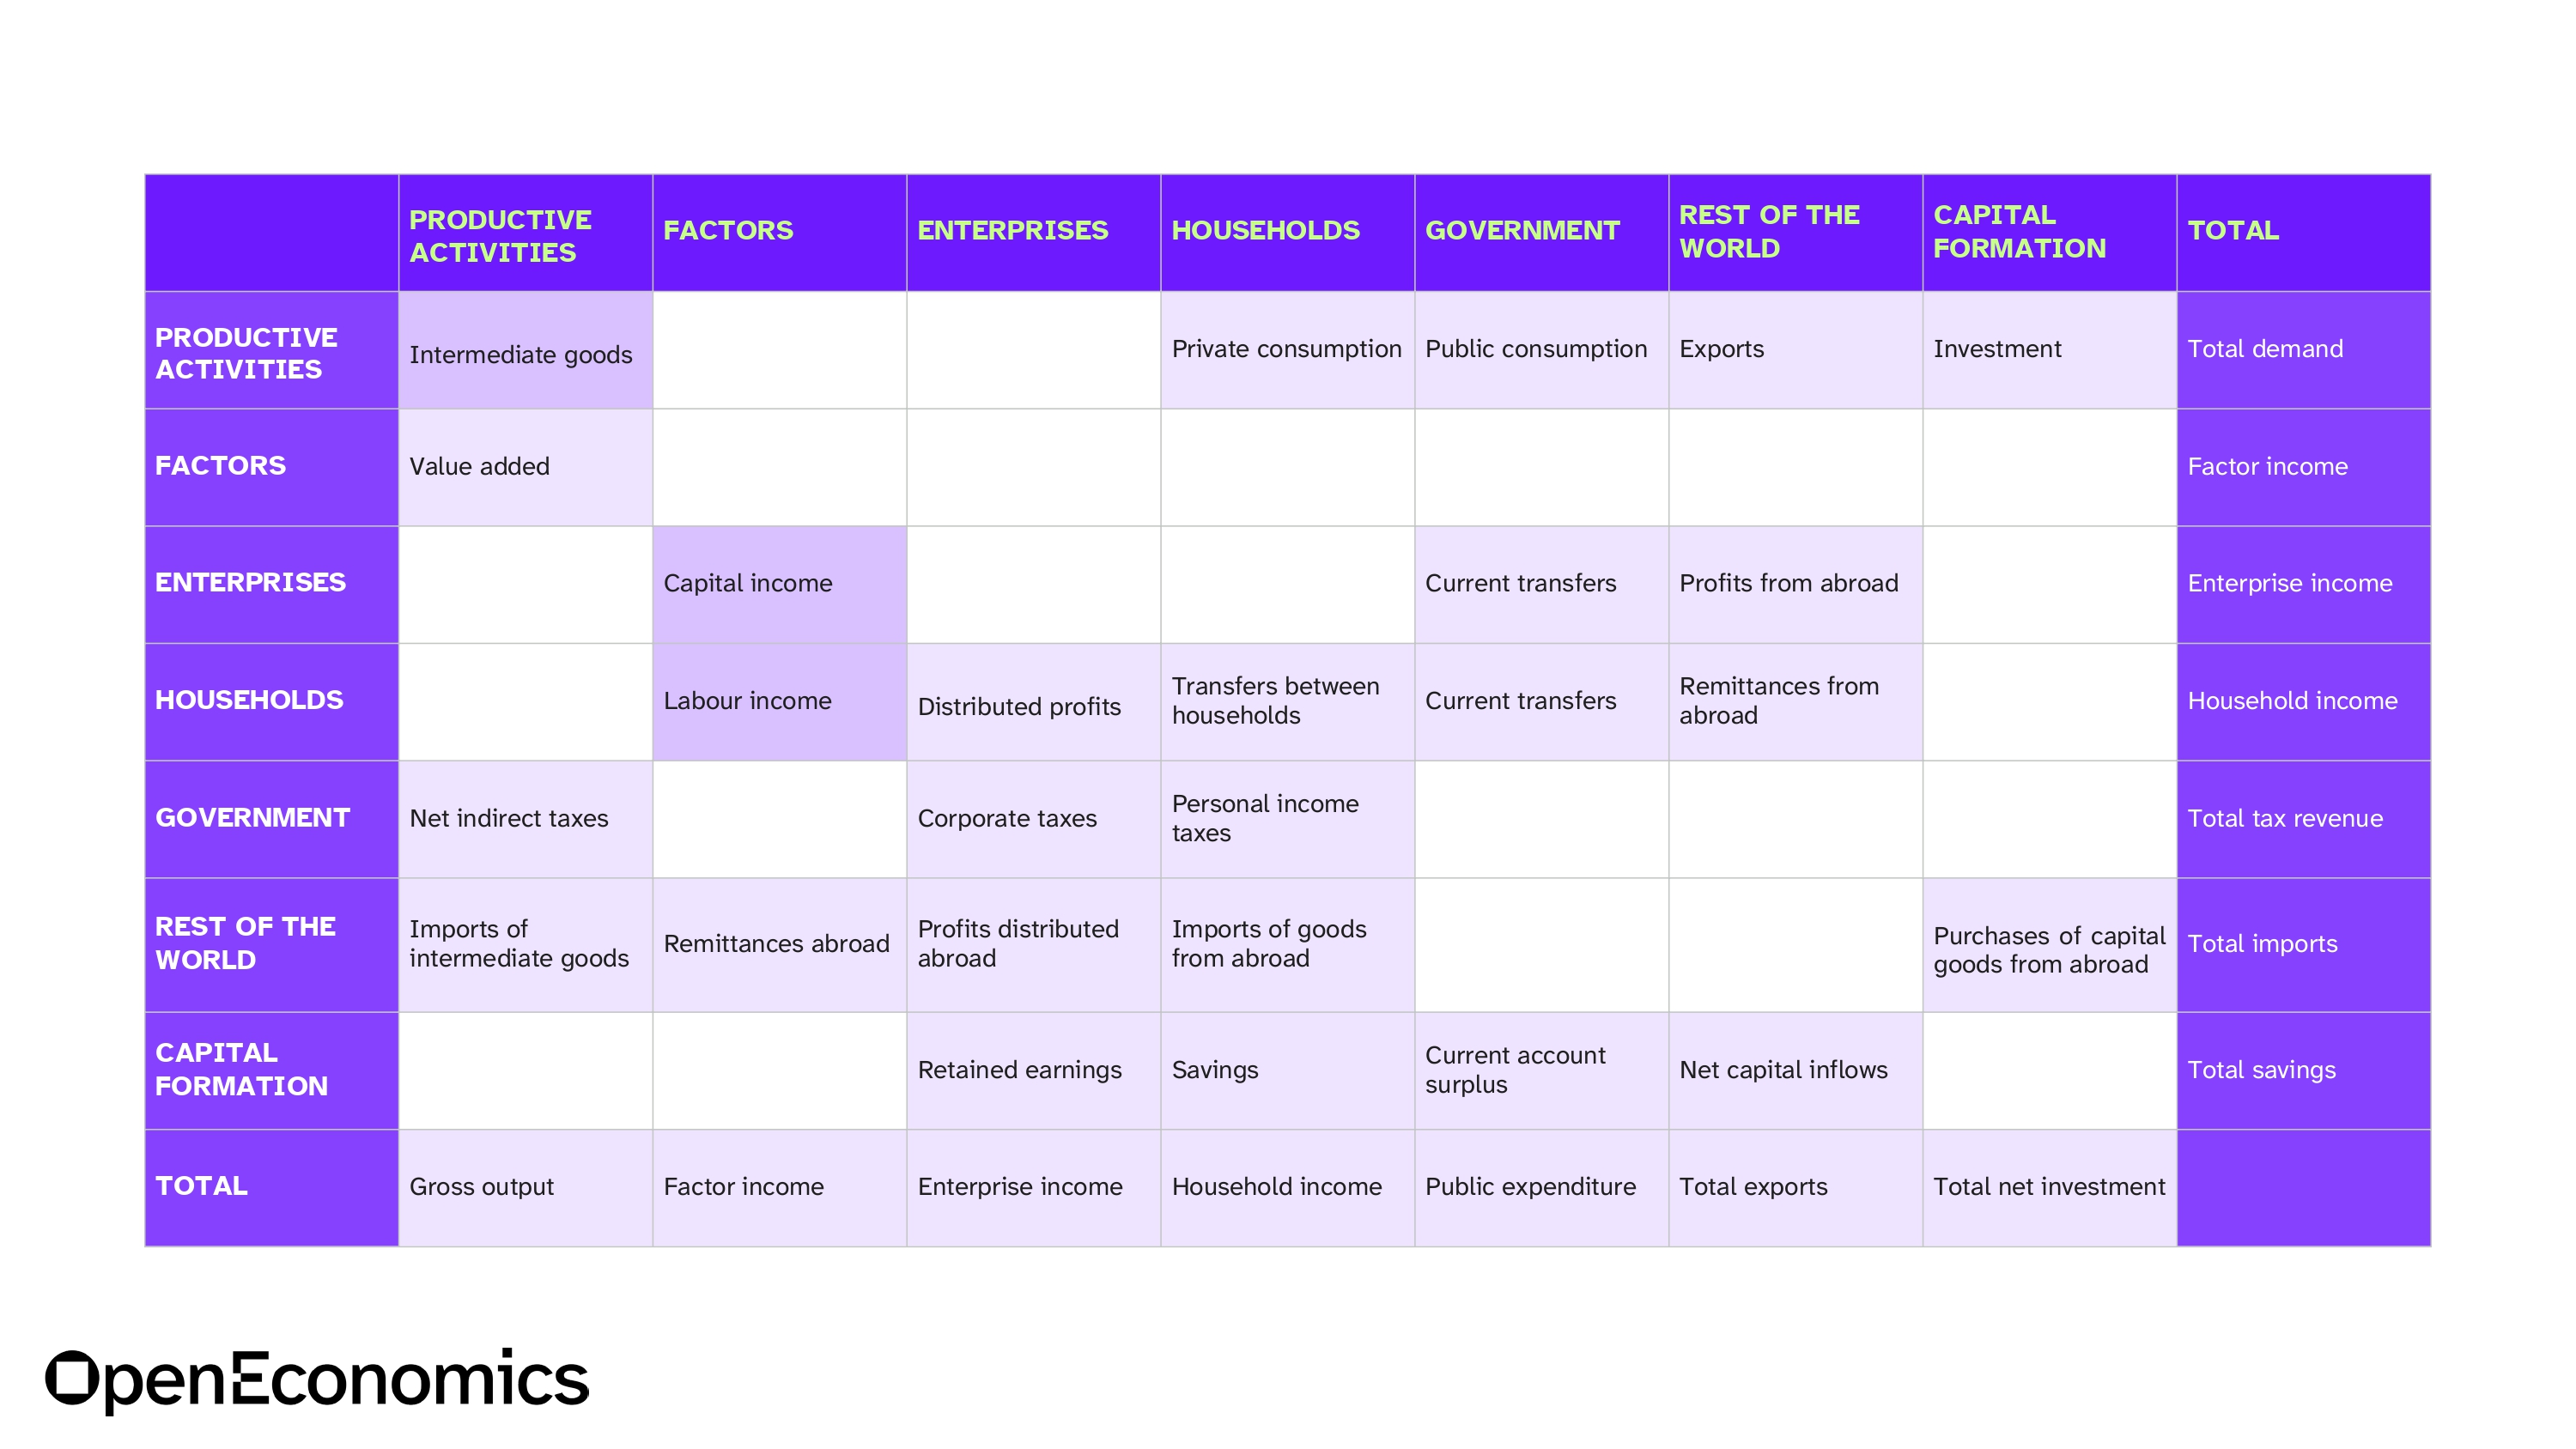
The methodological tool underlying this analysis is the SAM – Social Accounting Matrix. The SAM describes the structure of the economy as a system of circular relationships among its main agents: economic sectors, factors of production (labour, capital and taxes), households, businesses, government, the rest of the world and capital formation.
Reading the SAM by column means following costs: how a sector purchases intermediate goods, pays workers, remunerates capital and pays taxes. Reading it by row means following income: how households receive wages, transfers and profits. This circularity is precisely what makes the model capable of tracing the propagation of a shock throughout the entire economic system—and measuring it.
The SAM we apply at OpenEconomics uses the ISTAT classification of 63 sectors, based on national Input-Output Tables developed in-house and downscaled to progressively finer levels of territorial disaggregation, down to the provincial level. A methodology for downscaling at the municipal level is currently under development.
The three levels of propagation: direct, indirect, induced
When expenditure is analysed through this model, the effect does not end with the sector that receives it directly. It propagates in three successive waves—and the real value of the investment lies in the sum of the three.
Direct impact is the value generated by the sectors immediately involved. In the case of expenditure on construction, it is the value added generated by construction firms through the delivery of the project.
Indirect impact is the effect along supply chains. Construction firms require cement, steel, windows and doors, transport and technical services. Each supplier, in turn, activates other suppliers. Indirect impact captures the entire B2B propagation along the supply chain—sectors that apparently have nothing to do with the construction site, but depend on it.
Induced impact is the most subtle and often the most significant. Workers on the construction site and suppliers in the value chain receive income—and spend it: rent, groceries, services and leisure activities. This recirculation of income generates an additional round of demand and output, well beyond the original scope of the investment.
Propagation is calculated through the Leontief multiplier matrix (derived through successive processing of the SAM matrix), which transforms an initial demand shock into the overall impact on the entire economic system.
An important point for decision-makers: expenditure on construction does not only produce a building. It generates GDP, employment and tax revenue through a clearly traceable—and communicable—process.
The GDP multiplier: a useful tool, if interpreted correctly
The GDP multiplier is the most immediate indicator in the analysis: it measures how many euros of GDP are generated for every euro of expenditure. It is a concise, understandable figure, useful in presentations to boards and institutional stakeholders. Multipliers can also be calculated for all the other indicators included in the analysis.
But reading an impact analysis solely through multipliers is like reading a financial statement by looking only at the bottom line.
The multiplier tells you how much. The complete analysis tells you where, for whom and with what temporal structure. The difference is relevant when the figures must withstand scrutiny—before a managing authority, a funding institution or at a negotiating table.
When it is a decision-making tool – and when it also becomes a defensive one
Socioeconomic impact analysis is not only a tool to demonstrate value. It is also a tool to manage risk: reputational, regulatory and negotiation risk.
Its main applications include permitting, negotiations with public authorities and local governments, the management of community opposition, communication with shareholders and ESG reporting, investment evaluation and, where relevant, Environmental Impact Assessment (EIA) procedures.
A tool is only as effective as its methodology
The robustness of an analysis, and its ability to withstand scrutiny in the contexts where it is used, depends on the quality of what lies beneath it: continuously updated institutional datasets, alignment with international standards and robust models. It also depends on the ability to make all this understandable to those who need to present these figures in a boardroom, in a dossier or at a negotiating table.
Moreover, socioeconomic impact analysis delivers even greater value when it interacts with other dimensions of evaluation: economic cost-benefit analysis, which measures the efficiency of different investment alternatives, and the ESG framework, which places sustainability in its long-term context. Integrated together, the three tools provide a comprehensive perspective—not only how much an investment is worth to the economy, but whether it is worth undertaking and how it is positioned with respect to the organisation’s sustainability commitments.


.png)


.png)